ClimaPlus is an early-design web-tool, developed to facilitate the design of naturally ventilated and hybrid/mixed-mode buildings that are energy-efficient and low-carbon. The tool is being used for teaching in a residential course at MIT, as well as in a Massive Open Online Course (MOOC) on Sustainable Building Design that we developed in collaboration with MIT Energy Initiative.
Selecting or loading a climate file
OUTDOOR
Sun path diagram
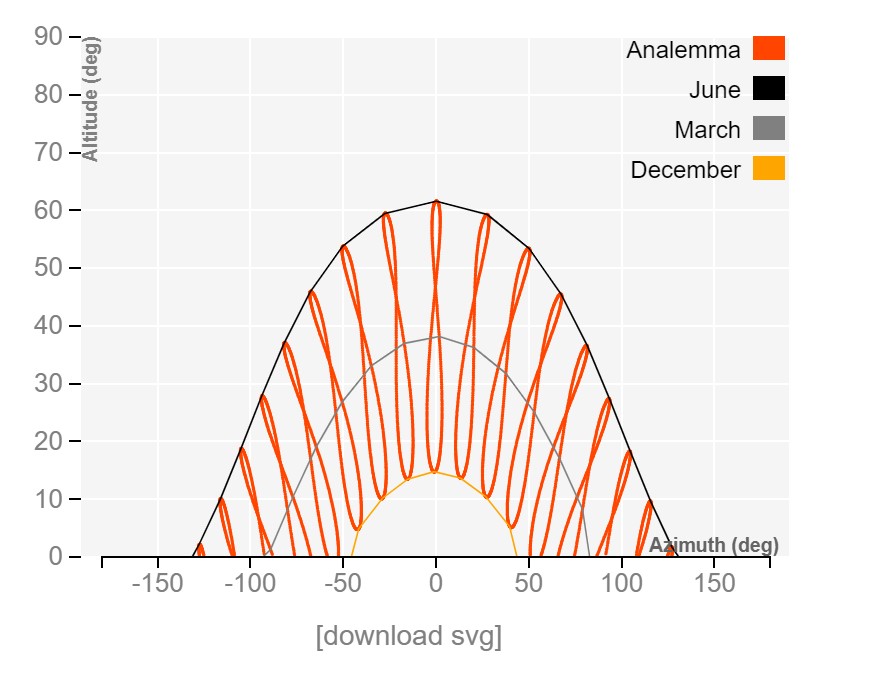
A sun path diagram is a 2-dimensional representation of the position of the sun with respect to given site over the course of the year. The figure can be used for outdoor direct shading studies or to predict the occurrence of glare indoors.
More>>
In the figure the position of the sun for each full hour in the year is given as the sun’s azimuth and altitude. The altitude corresponds to the height of the sun above the horizon. The azimuth angle is the angle between the projection of the sun’s position onto the horizon and due South. For example, an azimuth of minus 90° corresponds to due East. The orange objects in the figure are called analemmas and show the position of the sun for every day of the year for the same hour in local standard time. Their shape is a consequence of the Earth’s declination as well as the elliptical shape of the earth’s path around the sun. The solid yellow, and gray lines refer to the sun’s path on Dec 21, Mar/Sep 21 and Jun 21, respectively. For more information refer to MIT OCW Environmental Technologies in Buildings, Understanding Climate Solar Radiation or the Daylighting Handbook I chapter 5.
In the figure the position of the sun for each full hour in the year is given as the sun’s azimuth and altitude. The altitude corresponds to the height of the sun above the horizon. The azimuth angle is the angle between the projection of the sun’s position onto the horizon and due South. For example, an azimuth of minus 90° corresponds to due East. The orange objects in the figure are called analemmas and show the position of the sun for every day of the year for the same hour in local standard time. Their shape is a consequence of the Earth’s declination as well as the elliptical shape of the earth’s path around the sun. The solid yellow, and gray lines refer to the sun’s path on Dec 21, Mar/Sep 21 and Jun 21, respectively. For more information refer to MIT OCW Environmental Technologies in Buildings, Understanding Climate Solar Radiation or the Daylighting Handbook I chapter 5.
Monthly Façade Radiation
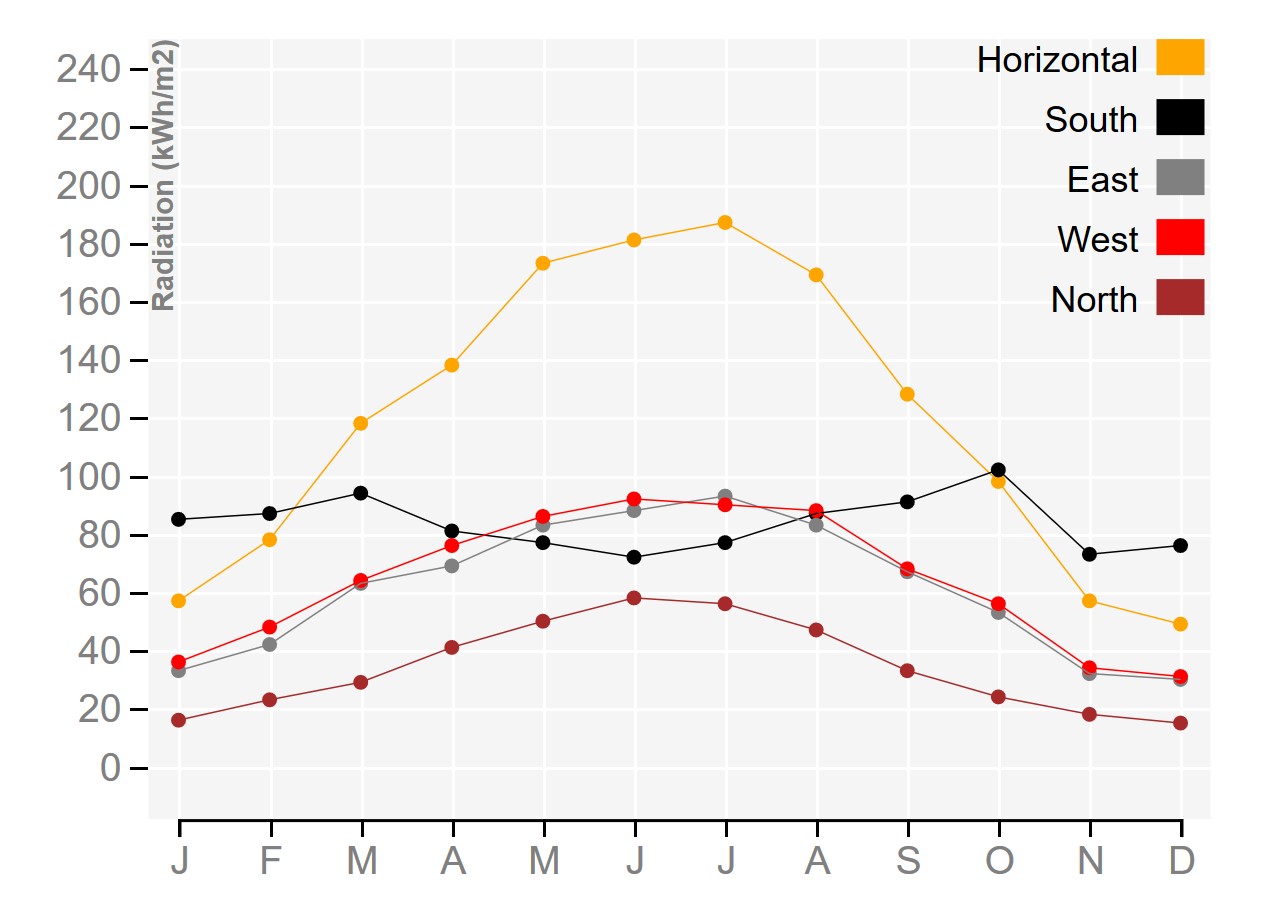
This graph shows the monthly solar radiation falling onto different surface orientations over the course of the year for a given site. It can be used for early massing studies.
More>>
The figure shows monthly radiation levels on facades facing in the four main cardinal directions as well as for an upward facing surface. The results can be used to decide whether it is advantageous for a building to be oriented along the West/East axis or not. For more information refer to MIT OCW Environmental Technologies in Buildings, Understanding Climate Solar Radiation or the Daylighting Handbook I chapter 3.
The figure shows monthly radiation levels on facades facing in the four main cardinal directions as well as for an upward facing surface. The results can be used to decide whether it is advantageous for a building to be oriented along the West/East axis or not. For more information refer to MIT OCW Environmental Technologies in Buildings, Understanding Climate Solar Radiation or the Daylighting Handbook I chapter 3.
Annual Solar Radiation Map
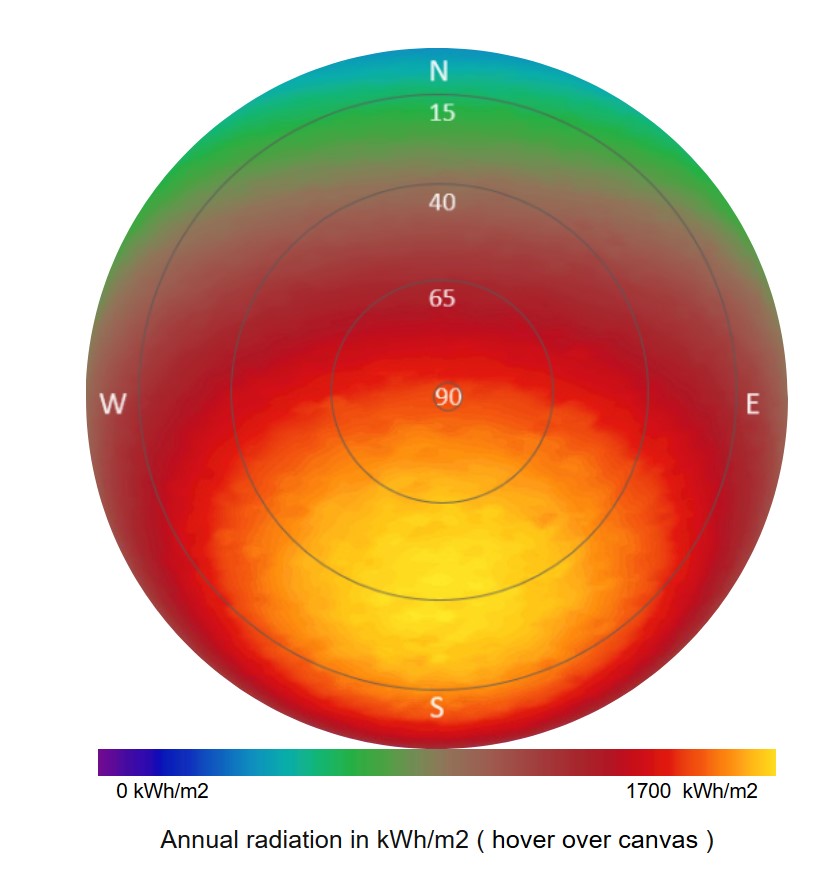
This graph shows the annual solar radiation falling onto any surface orientation from a given site. The graph can be used to position and size an unshaded PV system.
More>>
The figure shows a false color map that corresponds to the range of annual solar radiation possible at a given site. The center of the color map corresponds to an upward facing surface whose surface normal forms a 90° angle with the horizon. Top, left, right and bottom values correspond to façade orientations for North, West, East and South. In the example figure the maximum solar radiation (around 1700kWh/m2) occurs for a South facing surface with a tilt angle around 40°. If you hover your mouse over the figure, the solar radiation for the corresponding surface orientation is displayed below. For more information refer to MIT OCW Environmental Technologies in Buildings, Understanding Climate Solar Radiation or Active Solar as well as the Daylighting Handbook I chapter 3 and Daylighting Handbook II chapter 9.
The figure shows a false color map that corresponds to the range of annual solar radiation possible at a given site. The center of the color map corresponds to an upward facing surface whose surface normal forms a 90° angle with the horizon. Top, left, right and bottom values correspond to façade orientations for North, West, East and South. In the example figure the maximum solar radiation (around 1700kWh/m2) occurs for a South facing surface with a tilt angle around 40°. If you hover your mouse over the figure, the solar radiation for the corresponding surface orientation is displayed below. For more information refer to MIT OCW Environmental Technologies in Buildings, Understanding Climate Solar Radiation or Active Solar as well as the Daylighting Handbook I chapter 3 and Daylighting Handbook II chapter 9.
Outdoor Temperature
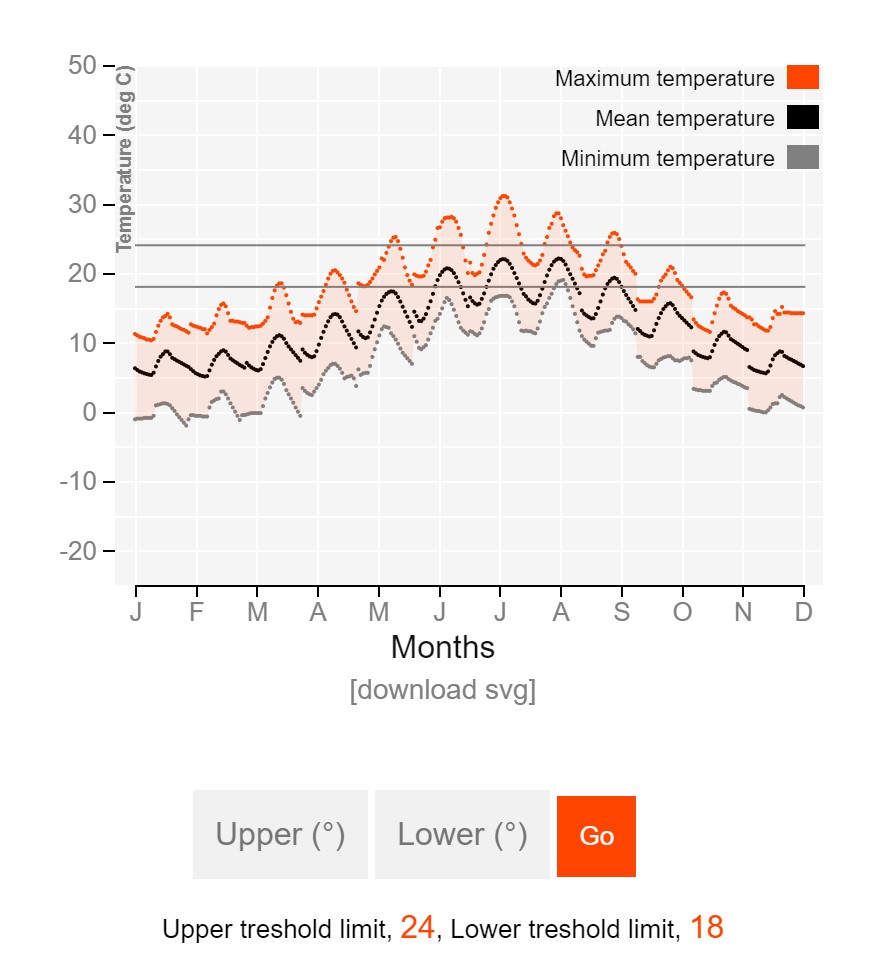
This graph shows typical daily temperature profiles for every month for a given site. The information can be used to initially gage the potential for natural ventilation and thermal mass as well as how hot or cold the climate is.
The figure shows twelve graphs, one for each month, that are pasted together. For each month the maximum (orange, average (black) and minimum (grey) temperatures over the course of the day are shown. For example, the figure shows that temperatures in January vary for this site between around 5°C at night and 10°C during the day with extremes ranging from around freezing to 10°C. The two horizontal solid gray lines show the upper and lower temperature thresholds and can be adjusted.
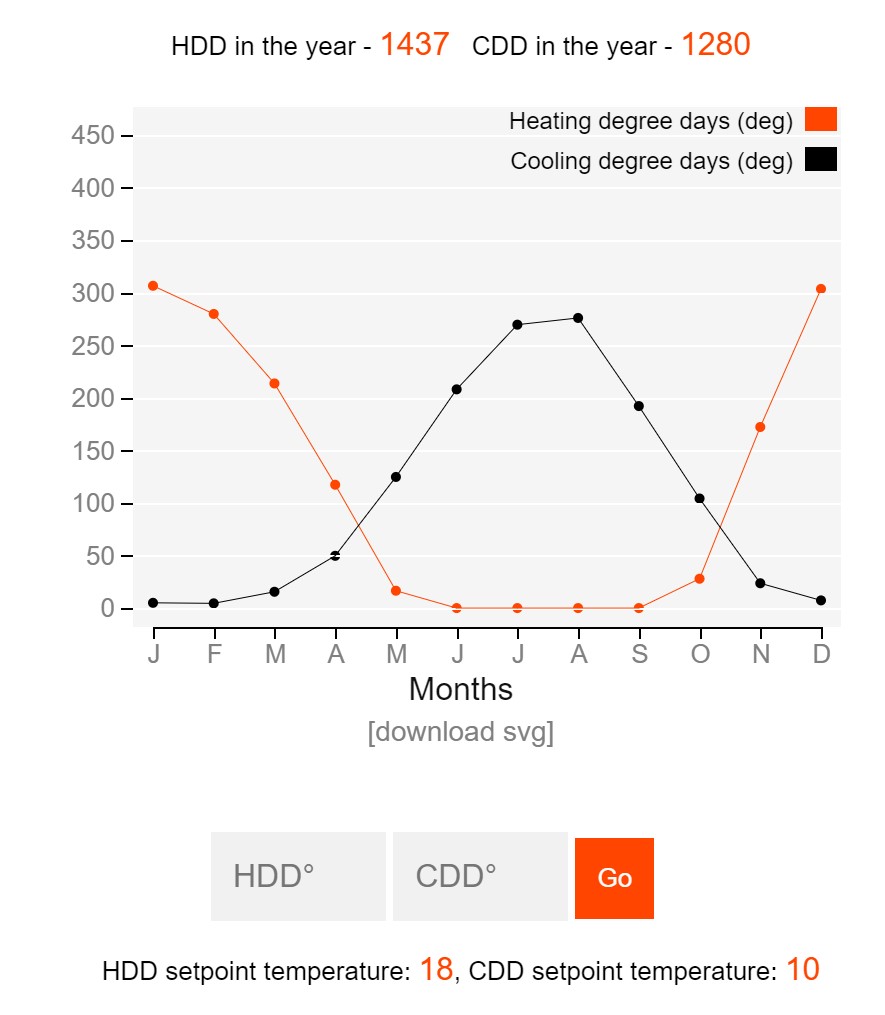
Degree Days
This graph shows monthly heating and cooling degree days for adjustable set point temperatures.
A heating/cooling degree day corresponds to the difference between the mean daily temperature and the heating/cooling set point temperature. For example, if the mean daily temperature is 12°C and the heating /cooling set point temperatures are 18°C/ 10°C, the heating/cooling degree days for that day are 6DD and 2DD, respectively. If set point temperatures correspond to the balance point temperature of a building, heating degree days are a good predictor as to when a building is in heating or cooling mode.
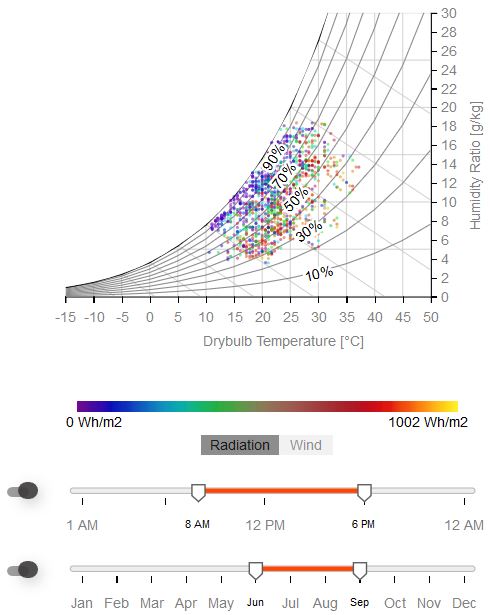
Psychrometric chart
This graph shows temperature and humidity for all or select hours in the year for a given site, representing physical and thermal properties of moist air in a graphical form. (Credit: Adopted from a responsive-d3 project by James Perakis)
Using the selection button, the graph provides additional information on wind speed and horizontal global radiation for all displayed hours with falsecolor. In the example figure hours between 8 am and 6 pm are selected for summer months. The maximum hourly radiation in the selected hours is 1002 Wh/m2, with temperature ranging between 10°C and 35°C.
Using the selection button, the graph provides additional information on wind speed and horizontal global radiation for all displayed hours with falsecolor. In the example figure hours between 8 am and 6 pm are selected for summer months. The maximum hourly radiation in the selected hours is 1002 Wh/m2, with temperature ranging between 10°C and 35°C.
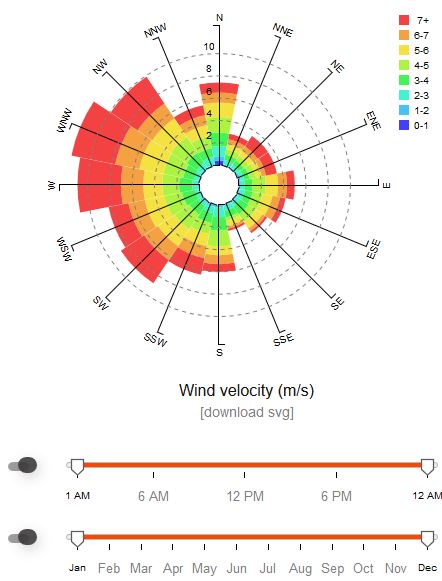
Wind Chart
This figure summarizes wind direction and velocity frequency distributions for all or select hours in the year for a given site.
The figure shows a wind rose with hourly wind data binned into 16 different direction. For each direction the outer radius of the color chart indicates the percentage of time when the wind is blowing from that direction. The color columns indicate the frequency distribution of the wind speed coming from that direction. For example, the wind in the example figure is most prevalent from WNW (around 11% of the year). 4% of the year the wind form that direction has a wind speed above 7m/s (red).
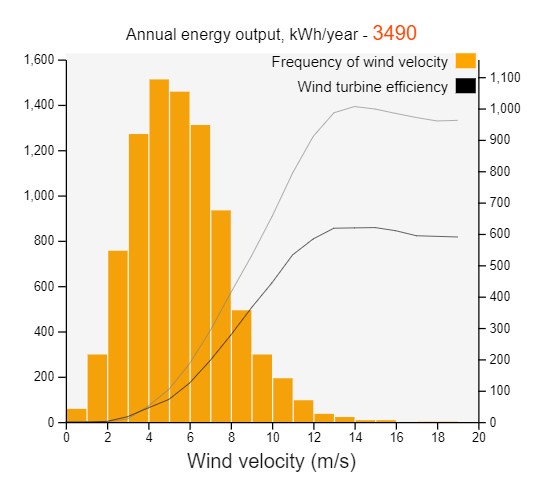
Wind Energy
This chart estimates the annual electricity yield of a generic 1000kWwind turbine.
The figure shows the frequency distribution of wind velocity along with the efficiency curve of a wind turbine as well as the resulting annual electricity yield for a given wind speed. The underlying model estimates the wind speed at a given height and rotor height and diameter.
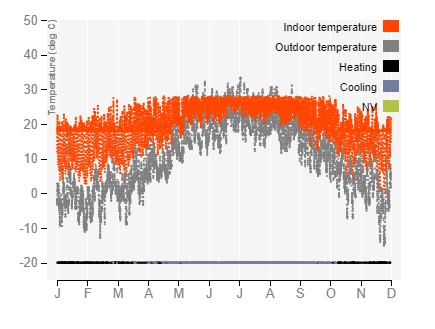
Indoor Temperature
The figure shows hourly indoor and outdoor temperatures over the course of the year. This data can be viewed in two ways. Hourly shows time series of all 8760 hours in the year.
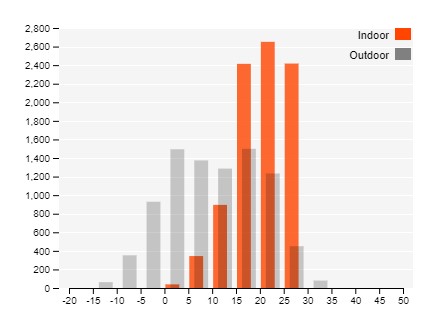
The frequency version of this graph shows the hours in the year when the indoor and outdoor temperatures are within a given temperature interval.
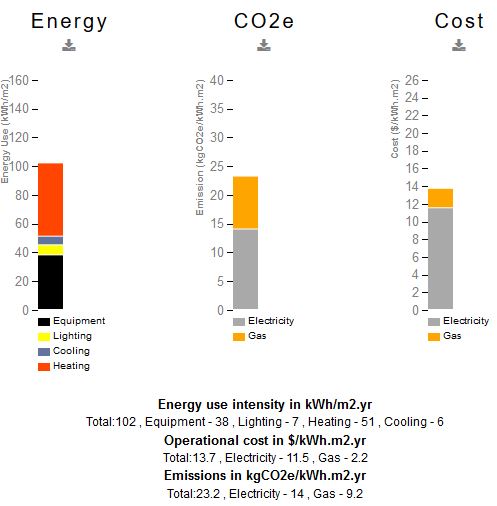
Energy and Emissions
The first figure shows the energy use intensity for the given ClimaBox design for cooling, heating, electric lighting and equipment. The energy use intensity corresponds to the sum of the different energy uses of the building divided by the conditioned floor area. The second figure shows CO2e emissions from gas and electricity and the last figure shows the cost of energy.
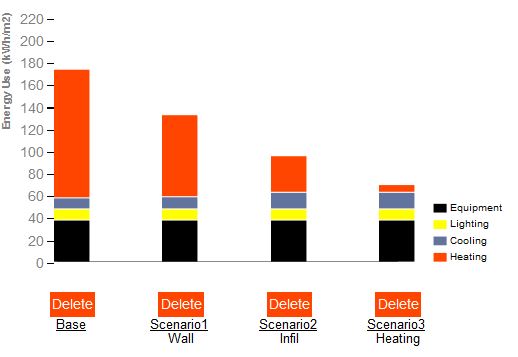
Saved Scenarios
This chart shows four different upgrade scenarios that are saved after running the energy calculations of the climabox. Starting from a base case, the selected building updagrades can be saved as scenarios 1, 2 or 3, with an additional custom name.
CLIMABOX GEOMETRY
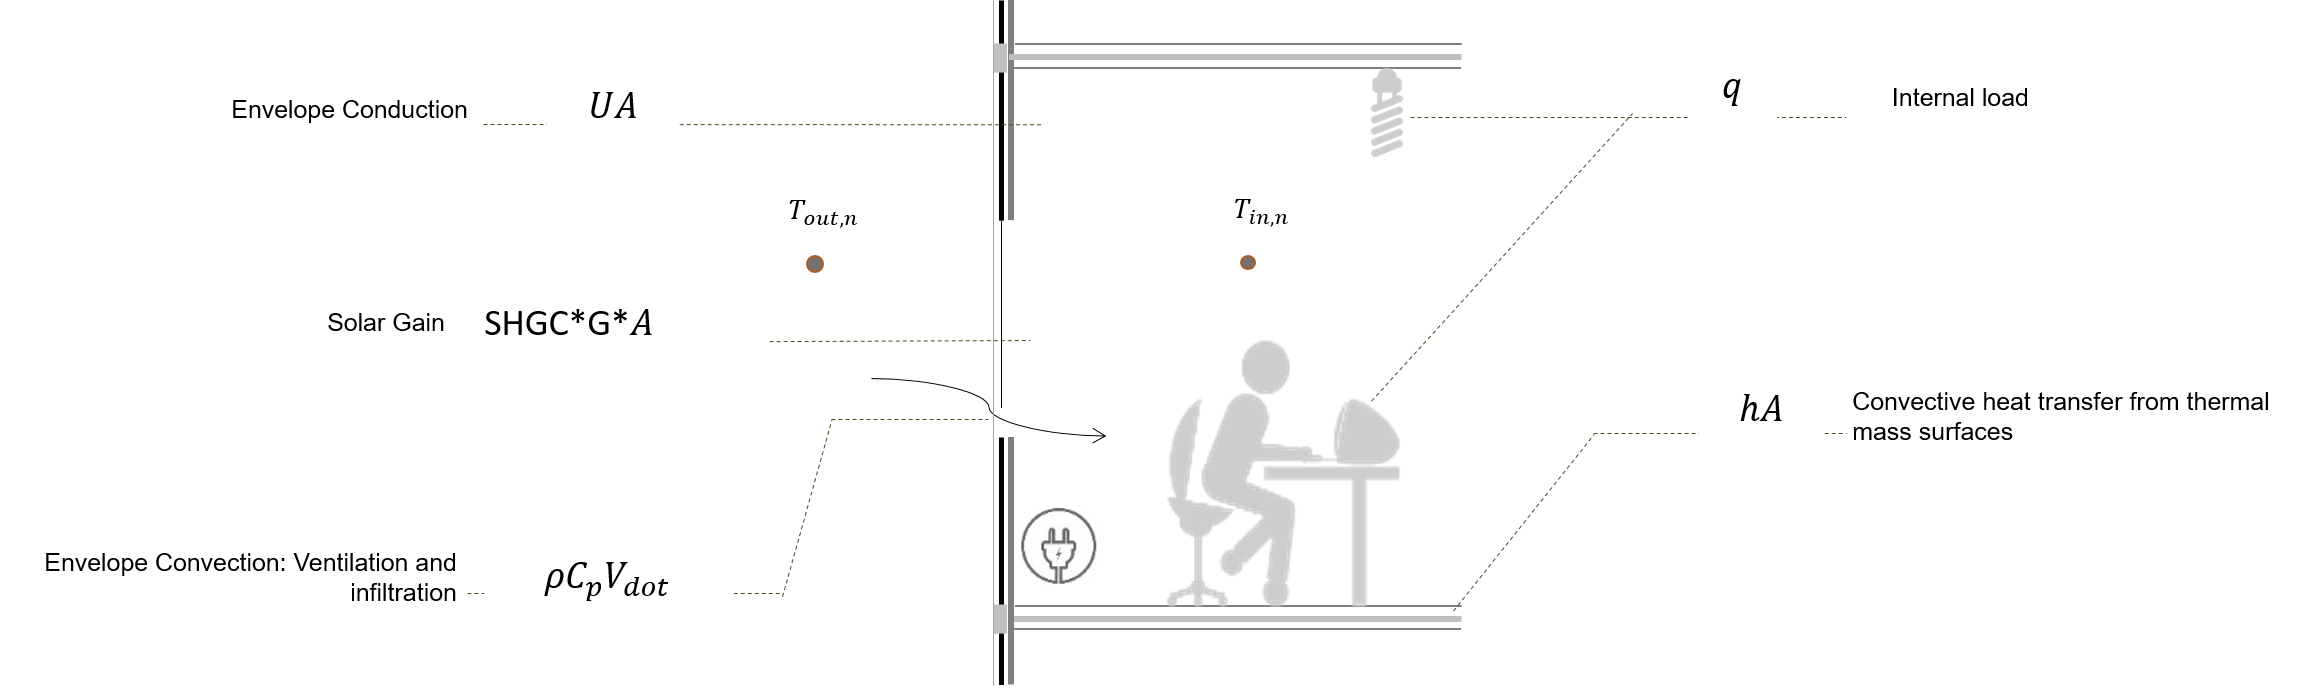
ClimaPlus includes a simple one zone thermal model to estimate the effect of key design parameters on indoor temperature and energy use for a given site. The model considers solar radiation onto different facades, one dimensional heat flow through walls, roof and windows, internal gains from solar radiation, equipment and occupants as well as thermal mass effects using a RC-based lag time constant.
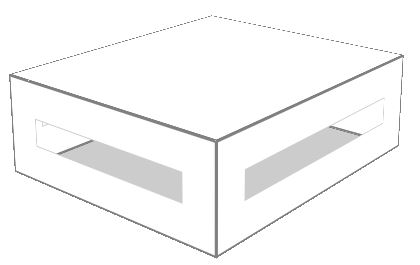
A ClimaBox is used as an abstraction of a building to predict comfort, energy performance, CO2 emissions, and cost for a naturally ventilated, hybrid or fully conditioned building.
Climabox Dimensions
These parameters define the inner dimensions of the one zone building model in meter. The building is oriented along the cardinal directions. W (m) input corresponds to the width of the West and East facing facades, L (m) defines the length of the North and South facing facades, and the third parameter H (m) corresponds to the interior floor to ceiling distance.
Window to wall ratio
The window-to-wall ratio for each façade corresponds to the percentage of glazing area vis-à-vis the overall façade area adjacent to the space.
CLIMABOX SETTINGS
Construction
The user can change the roof, wall and glazing constructions using predefine construction assemblies. The U-value of the different choices are provided in SI units. It is assumed that the floor of the building is adiabatic, i.e. there is no heat flow between the building and the ground.
Exposed thermal mass
The use can specify the amount of active thermal mass within the space. The exposed thermal mass corresponds to a 40mm thick concrete layer with a volumetric heat capacity of 2016kJ/m3 K.
Infiltration
The infiltration rate in Air Change per Hour (ACH) corresponds to volume of fresh air that enters the space through accidentals leaks in the building envelope.
Peak internal gain
These two input parameters set the peak gains from equipment and electric lighting for the space. The time of day schedules for a typical weekday are shown below.
Natural ventilation
The entry field specifies whether natural ventilation is supported or not. In the latter case, it is assumed that the windows are sealed (no operable). If the windows are operable, ClimaPlus uses the empirical formulas to predict the air exchange rate when the windows are opened. In the case of fan assisted outdoor air supply, it is assumed that an electric fan supplies outside air to the space at a rate of up to 5 ACH. For both options, the windows are opened if all of the following conditions are met: T_outside is between 18°C and 26°C, and T_inside > 20°C.
Conditioning system
In order to convert heating and cooling loads into energy use, ClimaPlus support a series of systems using constant coefficients of performance. Gas-fired boiler heating – COP 0.85, electric baseboard heating – COP 1, direct expansion cooling – COP 3, ground source heat pump – COP 3.93. Emissions
Carbon emissions from gas and electricity used for heating, cooling, lighting and equipment are calculated using the emission factors given in kgCO2e/kWh. Representative emission factors for some cities are given in the dropdown. And the ‘custom’ entry field allows to enter new values. Cost
Operation energy costs for gas and electricity are calculated using the cost of energy per kWh selected from the dropdown. Custom cost factors can be specified using the ‘custom’ option.